|
|
Tech Note 35: Using the NS Basic/Palm DebuggerAug 6, 2005© NSB Corporation. All rights reserved. |
The NS Basic/Palm Debugger is available starting with NS Basic/Palm 5.0. It allows you to
The Debugger works only with the Palm OS Emulator (POSE) - it cannot be run with a device or with the Simulator. It uses POSE's socket connection on Port 1000, so be sure to disable any security software you have that might block messages to that port.
It works using a special version of the Runtime called NSBRuntimeDebug.prc which needs to be downloaded to POSE, either on its own or as a Fat App. Do not use NSBRuntimeDebug on the Simulator or a device. It will not work. On POSE, it runs much more slowly than the regular Runtime.
Here is how to use it, step by step...
1. Put the IDE in Debugging mode.
a. Under Tools... Options... Compile/Download, set "Send to POSE", "Run Immediately" and "Debug Mode".
b. Start "POSE"
c. If you did not set "Compile into Fat App", then select "Download Runtime" from the Run menu.
2. Load the test program "DebugTest".
It is in the Projects\Samples folder. Click on the Click button to see the code behind it. You'll see three subroutines, one calling the other. You will also see that some statements start with a "© " character. There are breakpoints. They have no effect on released programs: they are only used for debugging. They are required to be in column 1 of the statement line.
3. Run the program.
Choose "Compile DebugTest" from the Run menu. The program will be compiled, downloaded and started on POSE.
You should now see the program message "Before". The program has started and is waiting in a MsgBox. This is not the same as a breakpoint. Control still lies with the app running on POSE: there is no interface with the IDE at this point. Click on "OK" to close the "Before" message.
Now, click on the "Click" button. This time, we stop on a breakpoint. There is no indication of this in POSE, but in the IDE, the code window opens with the breakpoint highlighted.

4. The Call Stack
Now, the fun begins. Let's look at the Call Stack. From the Run menu, select "Call Stack". You can see that we are in the module that gets called when Button1006 is clicked. We're at line 5 in subroutine or function called 'newFunction', which was called from the subroutine or function 'object1006'.

5. Variables
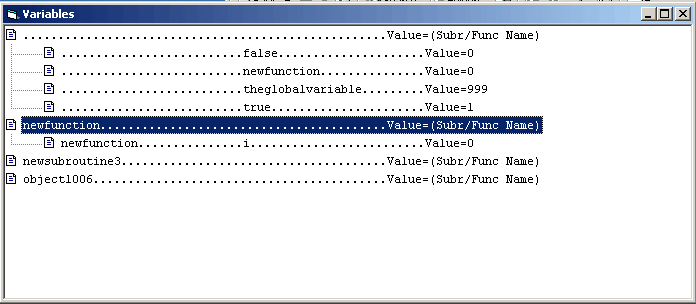
We can also look at the values of variables. From the Run menu, select "Variables". This is a treeview that shows all the different subroutines and functions that are active in your program. Click on one, and the variables are displayed. In this sample, we've expanded the top one, which contains our global variables and the function we're currently in.

5. Watch Variables
The Watch Variables screen is very much like the Variables screen, except it only shows the variable you select. You can add, delete, or clear all the variables from the Watch Variables screen.
6. Continuing Execution
You can continue execution from a breakpoint by selecting "Continue" from the Run menu. The program will then run normally. If another breakpoint is encountered, execution will stop again.
If you want to continue execution without stopping at any more breakpoints, choose "Continue without Breakpoints". Your breakpoints will be preserved for your next run.
7. Changing Breakpoints
You may change the locations of your breakpoints at any time during editing or execution by putting an "© " char at the first character of the line. The Run menu gives the option of clearing all breakpoints for the current module or program: this edits the source code and removes the "© " characters in the first position.
Changes to any statements will not affect execution until you recompile and download a fresh version of your program to POSE. Do not add or delete statements and continue running after a breakpoint: your program will not break at the correct position afterwards.
8. Shutting down the session
If you are running a program in debug mode, you can exit it at any time you would normally exit it. If you are at a breakpoint, POSE will lock up while it is waiting for a response from the IDE. You will need to continue the program from the IDE, or choose End from the Run menu.
When you exit NS Basic/Palm, the session is ended. If you leave POSE in a debug mode and it does not respond, a soft reset of it may be needed.